The Only Surface Finishing Chart (and Guide) You’ll Ever Need
Do you work with surfaces often? Have you come across a surface finishing chart? A chart can look complex and confusing, but it shows important data that you can use to improve the surface finish.
Whether you need to track the extreme irregularities of a surface or measure the overall average, you can compare the results with a surface finish chart.
Keep reading to learn how it works and everything else you need to know.

What Are Surface Finishes?
The surface finish is the physical appearance of a piece of metal or any other equipment. It determines how flat a surface is or not and if not, what makes it that way.
The first aspect of the finish is the lay, which is the direction of the surface pattern. In most cases, the production method will determine the lay of a given surface.
Next is the surface roughness, which measures the total space of irregularities on the surface. This is what engineers talk about when they talk about surface finish. The lower the number, the fewer irregularities the surface has.
If a surface has more space between irregularities, you can measure the waviness. Waviness can happen from deflection, vibrations, or warping. You can compare different finishes in a surface finishing chart.
Why Surface Finishes Matter
Surface finishes can affect the performance of the equipment. If you need to put two pieces together, you need a smoother surface so that they can fit.
When working with a vendor to produce parts, the vendor needs to use strong enough material to help the part function. Surface finishes can vary quite a lot, so you need to make sure the finish is just right.
Some surface finishes also have to meet certain standards. Consider if your surface finish has to meet these guidelines so that you can get the right finish.
How to Measure Surface Finishes
When looking at a surface finishing chart, you should consider how to measure finishes. You can use vapor honing and other methods to improve surface finishes. However, measuring the finish first can make sure you get the final result you need.
When measuring a surface, you have two options for measuring the finish.
First, you can use contact methods, such as dragging a measurement stylus to record the space between irregularities. If you can’t touch the surface but still need to measure it, you can use a non-contact method, such as 3D metrology.
Whether the surface is hot or you can’t touch it for another reason, metrology can come in handy for measuring the surface finish. Then, you can use a surface finishing chart to compare the surface to others like it.
Overview of Surface Finish Units
When you go to look at a surface finishing chart, you should know how to read the units on it. The units show the parameters, but different countries and organizations may use different measurements.
A finish chart can help you compare the differences between units so that you can convert them when necessary. As you review a surface finishing chart, consider what units you use. However, you should understand all of the units and terms you may see.
Consider the different parameters you can find on a surface finish chart.
Maximum Roughness Depth (Rmax)
The maximum Roughness Depth (Rmax) focuses on the deepest valley and the highest peak in the surface. It will sample lengths of the surface and select the largest values available.
Rmax is relatively sensitive, and it can small scratches can give it a higher reading than otherwise. When that happens, it can show up as being a rougher surface, even if the extremes only occur once.
Using Rmax can be helpful when determining the maximum roughness of a surface. Then, you can use other measurement methods to narrow it down from there.
Mean Roughness (Rz)
Mean Roughness (Rz) builds on Rmax by calculating the five deepest valleys and the five tallest peaks. This method can also produce a higher reading than you would get with other methods. However, it may be slightly more accurate than Rmax.
It can help you find how rough the surface may be, but it isn’t the most accurate option overall. You can use it to get an idea of the surface finish, and that can help you decide if you need to sand it or do some other treatment.
Rz isn’t a super common measurement for surface finishes, but it can help. If you want to see how rough your surface can be, it can be a useful tool.
Root Mean Square Roughness (RMS)
Root Mean Square Roughness (RMS) gets more accurate than the other measurement options. You can use it to get an estimate of the surface roughness, and it uses more math and points on the surface than Rmax and Rz.
To calculate RMS, you will use an algorithm that starts with the values and you will square those values. Next, it will take the average of those squares and then get the square root of the average.
RMS uses a sine wave to find the average curve, and you can see the average deviation from the mean line. This is a good option, but it’s still not as accurate as what you may want.
Roughness Average (Ra)
Roughness Average (Ra) is one of the most common parameters that you use when measuring surface finish. It focuses on all of the valleys and peaks on a surface, so it doesn’t face the same influence from extremes as Rmax and Rz.
Ra calculates the average length between all of the valleys and peaks, so it can find the average height of the surface. It won’t matter if there are a few outliers because the calculation focuses on the entire surface.
This is an excellent starting point if you want to get the most accurate results. You can then use Ra to compare the roughness with other measurement systems on a surface finishing chart.
Which Surface Finish Measurement Is Best?
Overall, the best surface finish measurement is Ra. It gives you the most accurate reading of the surface finish, and it’s common on a surface finishing chart.
While it can help to focus on the extremes with Rmax and Rz, those are more specific. You can use those measurements if you’re trying to compare parts of a single surface.
RMS falls somewhere in the middle because it’s more accurate than Rmax and Rz. However, it isn’t quite as accurate as Ra, which has a more complex calculation. But RMS could be a good option if you don’t want to calculate Ra.
What Is a Surface Finishing Chart?
A surface finishing chart contains information for common finish measurements. You can see columns for the following:
- Grit number
- ISO standard number
- Ra
- RMS
- Rmax
You may also see CLA, which is the center line average and measures the surface using microinches. Some charts also use Rt, which is an alternative for Rmax, so it can measure the deepest height of the surface roughness.
An international surface finish chart will also include American and metric units. While you may use microinches to measure Ra, you may also use micrometers, or microns. Both are correct, so having both on a chart can help you avoid confusion when working with others.
Ways to Use a Surface Finishing Chart
Another thing to consider is how you may want to use a surface finishing chart. Some finishing charts show the roughness grade numbers, and they convert them into both metric and American units.
Within the American and metric sides, you can see Ra and RMS measurements that qualify for a specific roughness grade. If you need to follow any standards, you can make sure your surface meets those standards.
If it doesn’t, you may need to buy and use a vapor honing machine. Then, you can use the right abrasive and method to smooth out the surface.
Compare and Convert Units
While you may know and understand one system well, you never know when you may need the other system. Perhaps you have always used the American system, but you work with someone who uses metric. The numbers are far apart, but there’s room for confusion.
For example, the numbers in the American system are larger, but as they get smaller with each roughness grade, they can approach the metric range. In the American system, roughness grade N4 using Ra is 8. But in metric, 8 is closer to grade N9, which is 8.3
Whether you use one or both measurement systems, being able to compare them is essential. It could mean the difference having between the right roughness grade or not.
Use Surface Roughness Charts
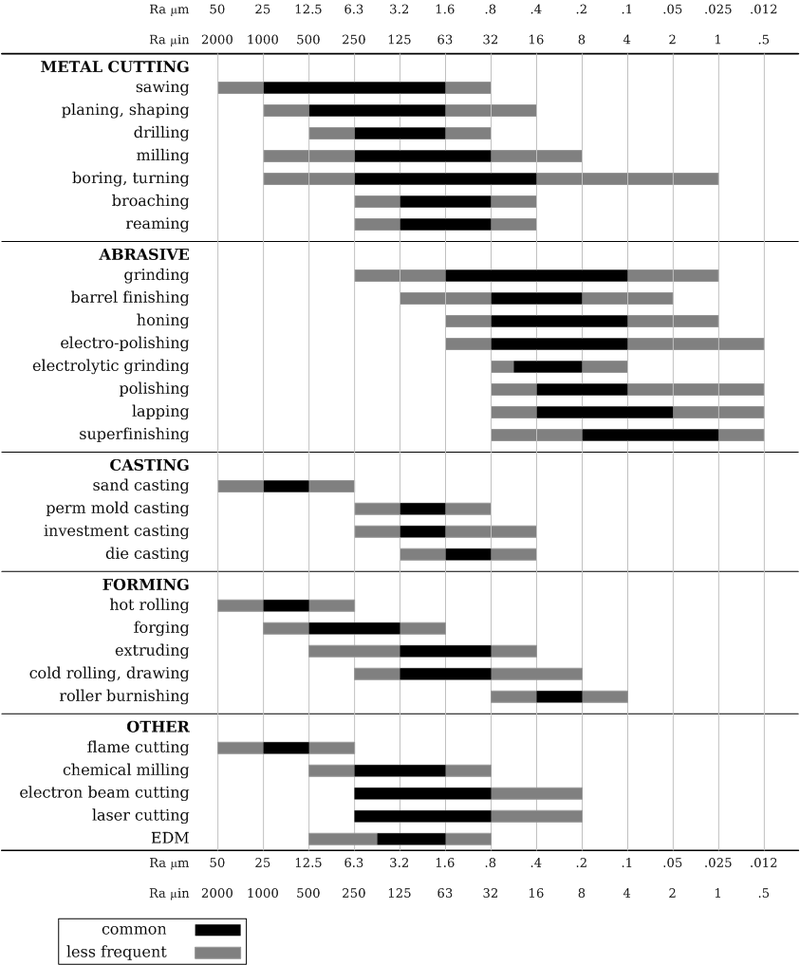
If you’re trying to decide on the best manufacturing process, you can use a surface roughness chart. It compares different production methods using the same material and can differentiate the surface roughness.
This type of chart gives the average finish for a particular process. While it doesn’t guarantee you will get those results, it can help you choose the right production method.
The chart can come in handy if you need to cut or otherwise adjust your metal parts. Even if you have finished parts, you may need to cut them, and so you’ll need to figure out the roughness for the new surfaces.
Different metal cutting processes can have different variations at the end. You may have some control over the end result, but you may need to use something to polish the surface.
Determine the Best Vapor Blasting Abrasive
Another way you can use a surface finishing chart is to determine the best abrasive. If you need to change the surface finish, vapor blasting can be a good option.
You can use water and the right abrasive to get the results you want. However, some abrasives are harder than others. Materials such as diamond and quartz are among the harder abrasives, while glass falls somewhere in the middle in terms of hardness.
If you want to make the surface as smooth as possible, you may want to choose a harder abrasive. That way, it can work well and get the job done faster.
Forming Materials
If you work with forming metal, you can also use a surface finishing chart. You can determine how smooth the part or product needs to be to complete the forming process. A finishing chart can work with rolling, forging, and extruding.
Do You Create a Surface Finishing Chart?
When working with surfaces, you don’t need to create a surface finishing chart. You can use an existing chart to tell you how your surface roughness relates to other surfaces.
While you will need to measure the surface yourself, you don’t have to know how each measurement relates to each other to create a unique chart.
Do You Have to Be an Expert to Use One?
Fortunately, you don’t have to be an expert in surface finishing to use a chart. As long as you can measure the surfaces that you work with and can read a chart, you can use it.
All you have to do is get the measurement from metrology tools or another method, and you can check the results against your surface finishing chart. Then, you can determine if it’s too rough, not rough enough, or just right.
Who Needs to Use a Surface Finishing Chart?
Anyone who works with surfaces and in manufacturing should be able to use a surface finishing chart. When everyone can read the chart, it won’t matter if someone is gone from the workplace that day.
And since it’s not too complicated, it shouldn’t take you much time to learn. As long as you know what to look for, you can figure out if the surface needs more finishing or not.
Using a Surface Finishing Chart
A surface finishing chart can be a useful tool when measuring surface roughness. The best surface chart should have more columns so that you can compare different measurements.
Then, you can use the chart to determine if your surface meets any necessary standards or if you need to adjust it. If you need to adjust it, you can determine how much, and you can use the right tools.
Do you need to adjust the surface finish of your parts? Visit our shop to buy vapor blasting equipment and get your parts smooth or rough today.


